

By Sophia Lopez, Founder & Chief Researcher — Cryptophia Research | 12 April 2026
The market consensus is that you need macro clarity before getting comfortable with bitcoin exposure. Wait for the Fed to signal, watch the dollar, watch yields. It’s a reasonable framework if it’s accurate.
It isn’t.
Binance Research published a case study on April 6th laying out what on-chain and ETF flow data has been quietly saying for months: BTC’s correlation with a global monetary easing breadth index shifted from +0.21 before spot ETF approval to −0.778 in 2026. That isn’t drift. That’s a structural reversal three times stronger in the opposite direction. The mechanism that drove BTC’s historical macro sensitivity — retail speculation fueled by current risk appetite — has been partially displaced by institutional capital that prices BTC as a monetary asset and front-runs policy cycles by six to twelve months.
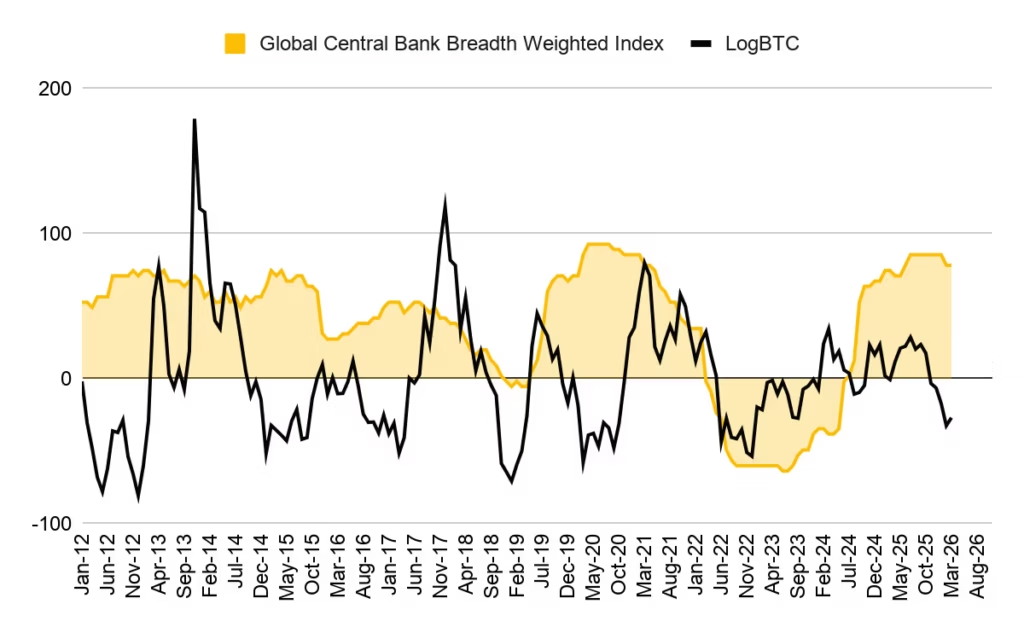
BTC & Global Central Bank Breadth Weighted Index. Source: CoinDesk
Waiting for the Fed to ease before adding BTC exposure means arriving after the institutional positioning has already occurred.
What the Geopolitical Test Actually Proved
The Iran conflict — “Operation Epic Fury” — gave us the clearest real-world stress test of this inversion thesis in years. When Brent crude first crossed $100 at the onset of the conflict, gold initially rallied alongside oil — both acting as safe-haven assets. What followed was more revealing: over the next five weeks, as the geopolitical premium unwound, gold shed roughly 15% from its $5,423 war peak. In that same window, BTC gained approximately 7%. Gold was liquidated when the crisis normalized. BTC was not. That is not a random correlation artifact. Gold is supposed to be the flight-to-safety asset. The S&P 500 confirmed its death cross in late March and has traded below both its 50-day and 200-day moving averages since. Bitcoin moved in the opposite direction.
Over 32 days from conflict onset through early April, BTC is up roughly 1% (peak: +14%), ETH up 6% (peak: +22%), while the S&P remains negative. The absolute numbers aren’t dramatic. The direction is. In a period of hard geopolitical stress, BTC held and equity markets didn’t. That used to be gold’s job.
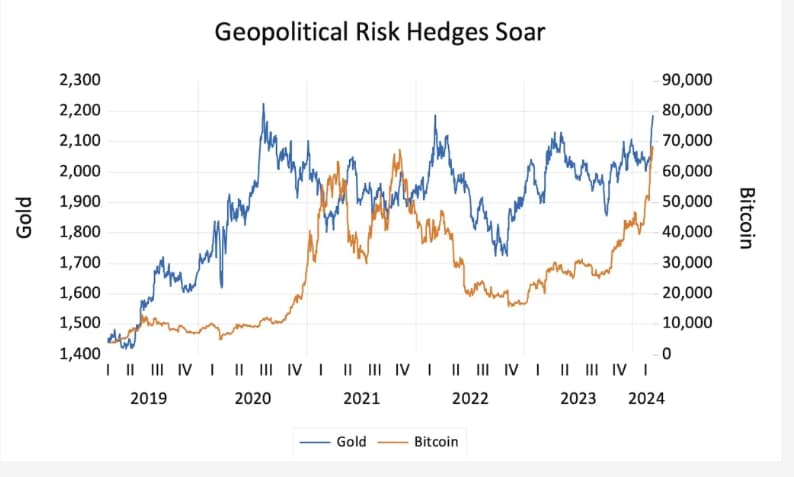
Geopolitical Risk Hedges – Gold vs Bitcoin. Source: topforeignstocks
I find the gold comparison more telling than the equity comparison. BTC’s 365-day correlation with gold stood at approximately 0.65 in mid-2025 — the two assets largely moved together over longer horizons — they largely moved together. When those two assets then diverge sharply under geopolitical stress, with BTC holding while gold sells off post-peak, the market is issuing a verdict: BTC is being re-rated as a monetary asset in its own right, not as a gold proxy.
The Dollar Is Confirming the Setup, Not Driving It
DXY hit 100.48 on March 30th. By April 10th it was at 98.69 — down roughly 1.8% in ten days. Real yields have been declining since February: from 1.75% to 1.47% in March, with a mild bounce to 1.58% in April that reads as noise against the trend. High-yield credit spreads tightened roughly 50 basis points over the prior two weeks, settling at 2.90% on April 9th. VIX closed below 20 for the first time since late February, after briefly touching 28 intraday on the April 7th shock before the ceasefire announcement.
All of this is constructive for risk assets. A weakening dollar loosens global dollar funding. Declining real rates reduce the opportunity cost of holding a non-yielding asset. Tightening credit spreads signal that risk appetite is recovering, not deteriorating.
But here’s what I want to be precise about: this macro setup is corroborating the BTC thesis, not driving it. The old mental model — “Fed loosens → dollar drops → BTC rallies” — implies BTC is a passive, late-cycle beneficiary. What we’re seeing now is BTC moving ahead of macro easing because institutional capital is positioning ahead of it. The macro data confirms the environment isn’t hostile. The ETF and on-chain data tell you where the actual conviction sits.
Don’t confuse a tailwind for an engine.
The Chain Isn’t Waiting for Permission Either
Exchange reserves have been in consistent net outflow every month since February 2026. Total exchange BTC sits at 2.706 million as of April 8th — and Coinbase specifically has dropped from roughly 980,000 BTC in early 2025 to the mid-860,000 range. Depositing addresses, the actual population initiating moves toward exchange, are at their lowest level in a decade. Supply is leaving the market’s liquid layer at a pace that doesn’t show up in price.
Long-term holder supply is above 14.5 million BTC and has been rising since mid-February. That means through a drawdown exceeding 47% from the October 2025 all-time high, the cohort with the lowest historical probability of panic-selling is not selling. They’re accumulating. In prior cycles, LTH distribution during a price correction was a cleaner signal that the top was structural rather than cyclical. That signal isn’t present.
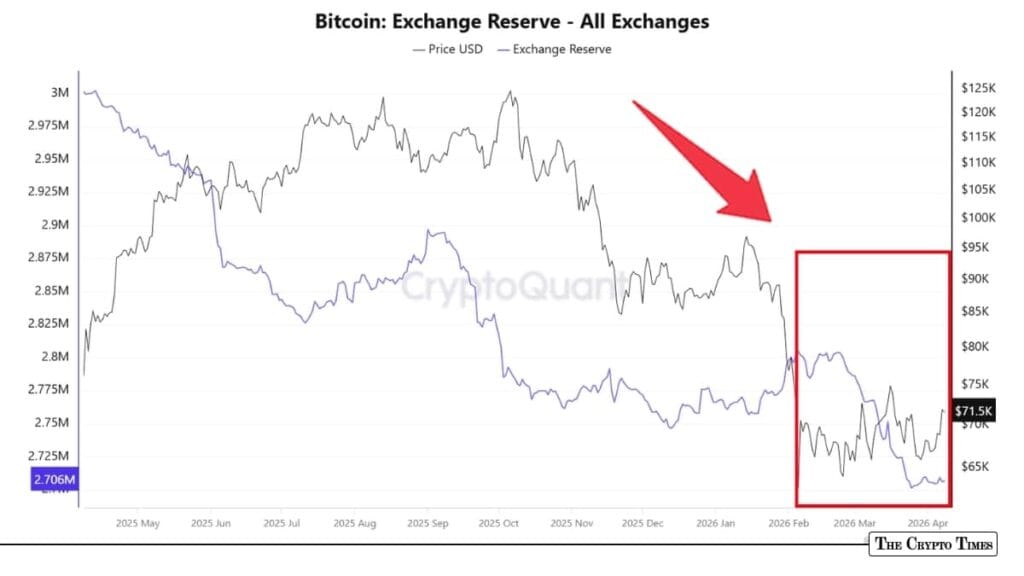
Bitcoin Exchange Reserves Continue to Shrink Despite Price Pressure. Source: CryptoTimes / CryptoQuant
The stablecoin picture adds another layer. Total stablecoin supply hit $315 billion at end of Q1 2026, up roughly $8 billion quarter-over-quarter. USDC supply is around $78–81 billion with CEX reserves up 12% in Q1. USDT CEX reserves fell 12% over the same period and on-chain USDT volume dropped 17%. The stablecoin rotation from USDT to regulated USDC isn’t a noise event — it’s institutional-grade rails being loaded. There is dry powder on the sidelines. It is parked in increasingly compliance-friendly structures.
The ETF Mechanism Is Rewriting the Demand Architecture
Spot ETFs have accumulated $56.51 billion in cumulative net inflows — 712,280 BTC locked into institutional-grade custody that does not hit exchange order books. March 2026 was the first positive inflow month since October 2025 at $1.32 billion. April opened with $471.4 million on the 6th — the sixth largest single-day inflow of 2026 — followed by $358.1 million on the 9th. These are not retail tourists chasing a momentum run. These are institutional flows with quarterly mandates and risk committee approval cycles.
Bitwise’s forecast, cited in Binance Research, is that ETFs will absorb more BTC than total new issuance in 2026. Annual new issuance post-halving runs roughly 164,000 BTC. If the ETF demand trajectory holds, you get a supply imbalance that doesn’t require a favorable macro environment to persist. It requires continued institutional adoption, which is a structural trend.
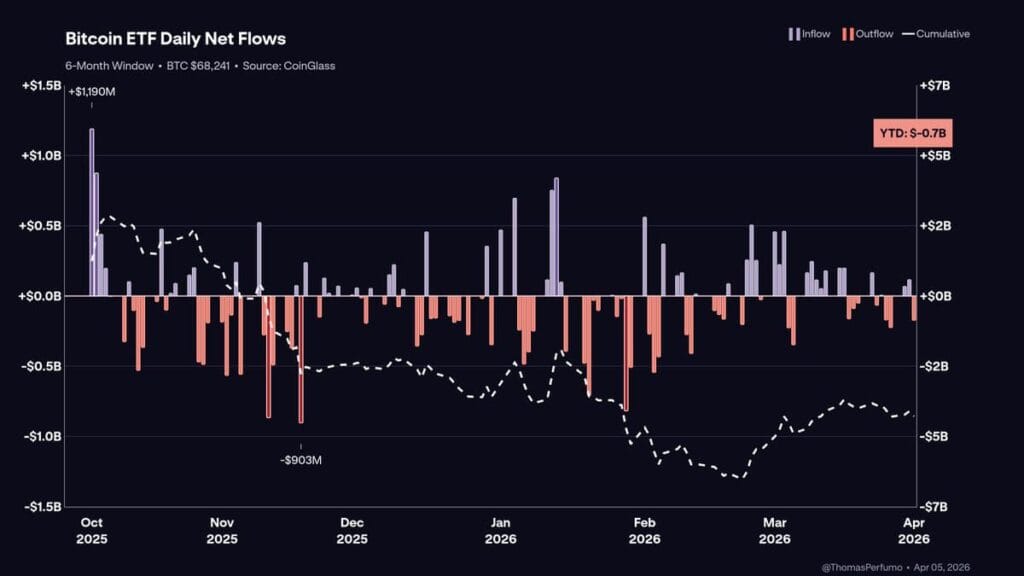
Bitcoin Spot ETF Daily & Cumulative Net Flows. Source: CoinGlass
What changed the signal hierarchy is not just that ETFs exist. It’s that investors using them operate on different time horizons than the perp traders who used to drive BTC’s macro sensitivity. They price BTC six to twelve months ahead of anticipated Fed action. When retail was the marginal buyer, BTC was a high-beta expression of current risk appetite. When institutional allocators are the marginal buyer, BTC becomes a leading indicator of macro expectations — not a lagging one.
The signal hierarchy for BTC has been reordered. ETF weekly flow data is now primary. LTH supply and exchange reserves are secondary. Fed communications — the variable everyone watches most closely — has dropped to a distant fourth.
The One Scenario Nobody Is Pricing Correctly
The leverage picture is currently clean. Perpetual funding rates are mildly positive — not overheated. There were brief negative episodic readings around the April 7th volatility spike before settling back constructive. The funding rate profile is not consistent with a crowded long-side setup. That matters because the real bear case for this thesis isn’t a macro reversal — it’s a leverage cascade that forces institutional de-risking.
The setup that breaks this: real yields spike back above 1.8% in a sustained way, the dollar reclaims 102+, and ETF flows go negative for multiple consecutive weeks. If institutional allocators face redemption pressure across their broader books and are forced to cut BTC exposure for liquidity reasons entirely unrelated to the BTC thesis, the six-to-twelve-month pre-positioning lead collapses. They are the structural buyers in this setup. If they become forced sellers, there is no retail floor thick enough to absorb it cleanly.
The on-chain data will tell you before price does. Watch for LTH supply beginning to distribute — cold wallet to exchange flows accelerating — and Coinbase reserves reversing their multi-month decline. If those flip simultaneously with sustained ETF outflows, the thesis isn’t just weakened. It’s broken.
One additional risk worth naming plainly: the correlation inversion is recent. The +0.21 → −0.778 move happened largely post-ETF approval. We have limited history of how this structure behaves in a genuine liquidity seizure — not a geopolitical shock, but an actual credit event where institutions sell everything with a bid. March 2020 showed that even gold was liquidated in the first deleveraging wave. BTC’s new safe-haven bid has not been stress-tested in that environment yet.
Where I Stand and What Would Change It
For long-term allocators, the structural case is cleaner than it’s been for most of 2025. The framework shift is the most important thing to internalize: you are no longer waiting for the Fed to confirm before positioning. Institutional capital is already six to twelve months ahead of that approach. The on-chain setup — falling exchange reserves, rising LTH supply, $315 billion in stablecoin dry powder, no leverage crowding — is the most coherent accumulation configuration I’ve seen since mid-2023.
For traders, the current range between $67,000 and $75,000 with mildly positive funding and no visible OI blow-off is a structurally low-risk zone relative to where the pressure points are. The path of least resistance is higher while macro remains constructive and ETF flows hold. But watch the weekly flow data — this thesis is only as durable as institutional demand persistence.
One red flag that would break the entire setup: three consecutive weeks of negative ETF net flows coinciding with LTH cold-wallet-to-exchange transfers exceeding 20,000 BTC in the same window. That combination would signal institutional rotation out, not a temporary pause. Until that shows up, the signal hierarchy says the structural bid is intact.
The framework that told you to wait for the Fed is the framework that had you late in every institutional-led move of the past two years. I’d retire it.
Cryptophia Research. Signal over noise.
NFA. All analysis is for informational purposes only.
Sources
- Binance Research — “Monthly Market Insights: April 2026,” April 6, 2026
- Yahoo Finance — “Binance Case Study: Bitcoin Price Is Decoupling From the Fed and Macro,” April 6, 2026
- BingX — “Binance Research: Bitcoin’s Correlation Flipped as ETFs Lead Macro Pricing In,” April 6, 2026
- Bitcoin Foundation — “Bitcoin Now a Leading Macro Indicator, Not Lagging Asset: Binance Research,” April 2, 2026
- Investing.com — “US-Iran War: Operation Epic Fury Sends Gold, Oil Sharply Higher,” March 2, 2026
- AInvest — “Gold Loses 15% From War Highs as Operation Epic Fury Safe-Haven Trade Unwinds,” April 4, 2026
- BingX — “Gold Slides to $4,623.93/oz After March Jobs Surprise, Down from War Peak,” April 4, 2026
- Morocco World News — “Iran-US-Israel Conflict Shapes Crypto’s Biggest 2026 Stress Test,” April 10, 2026
- Trading Economics — United States Dollar Index (DXY) Historical Data, accessed April 2026
- Yahoo Finance — “Bitcoin ETFs Snap Four-Month Outflow Streak With $1.32B in Inflows,” April 2, 2026
- MEXC — “Bitcoin Achieves First ETF Monthly Inflow in 2026,” April 1, 2026
- MEXC — “US Spot BTC ETFs Record Inflow: $471 Million,” April 6, 2026
- OpenPR (BTCPressWire) — “Bitcoin News: Spot ETFs Record $471.4M Inflow, 6th Largest of 2026,” April 7, 2026
- X (@CryptoPatel) — “US Spot Crypto ETFs Flows Data Update (09-04-2026),” April 9, 2026
- Glassnode (@glassnode) — “Bitcoin’s Short-Term Correlation with Gold Has Flipped Negative (30D: −0.53),” September 9, 2025
- Newhedge.io — Bitcoin vs Gold 30-Day Rolling Correlation Chart, accessed April 2026