

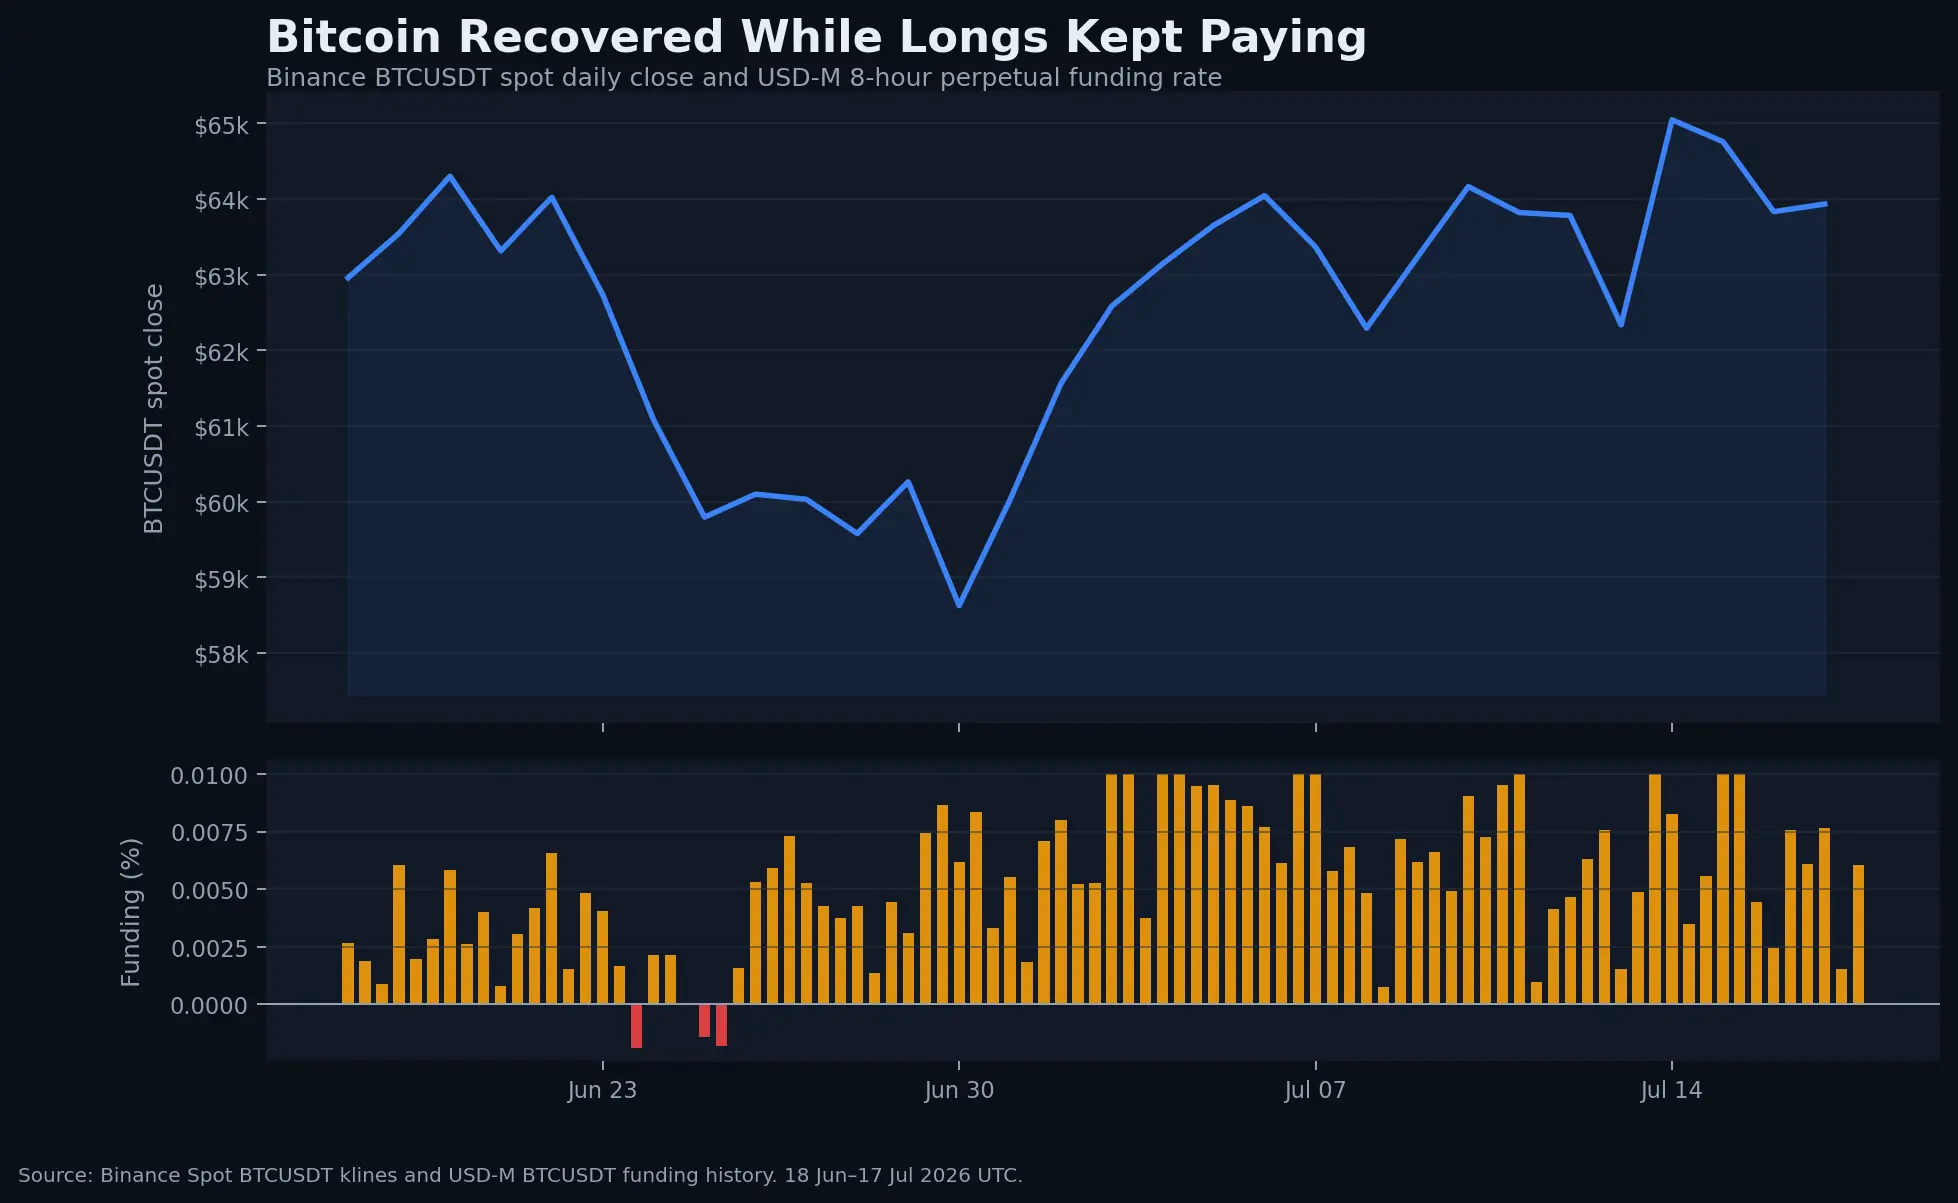
Bitcoin has repaired the late-June breakdown. Binance Spot BTCUSDT closed at $63,931.67 on July 17, 9.1% above its June 30 close and 1.5% above its June 18 close. That is a real recovery.
It is not a clean one.
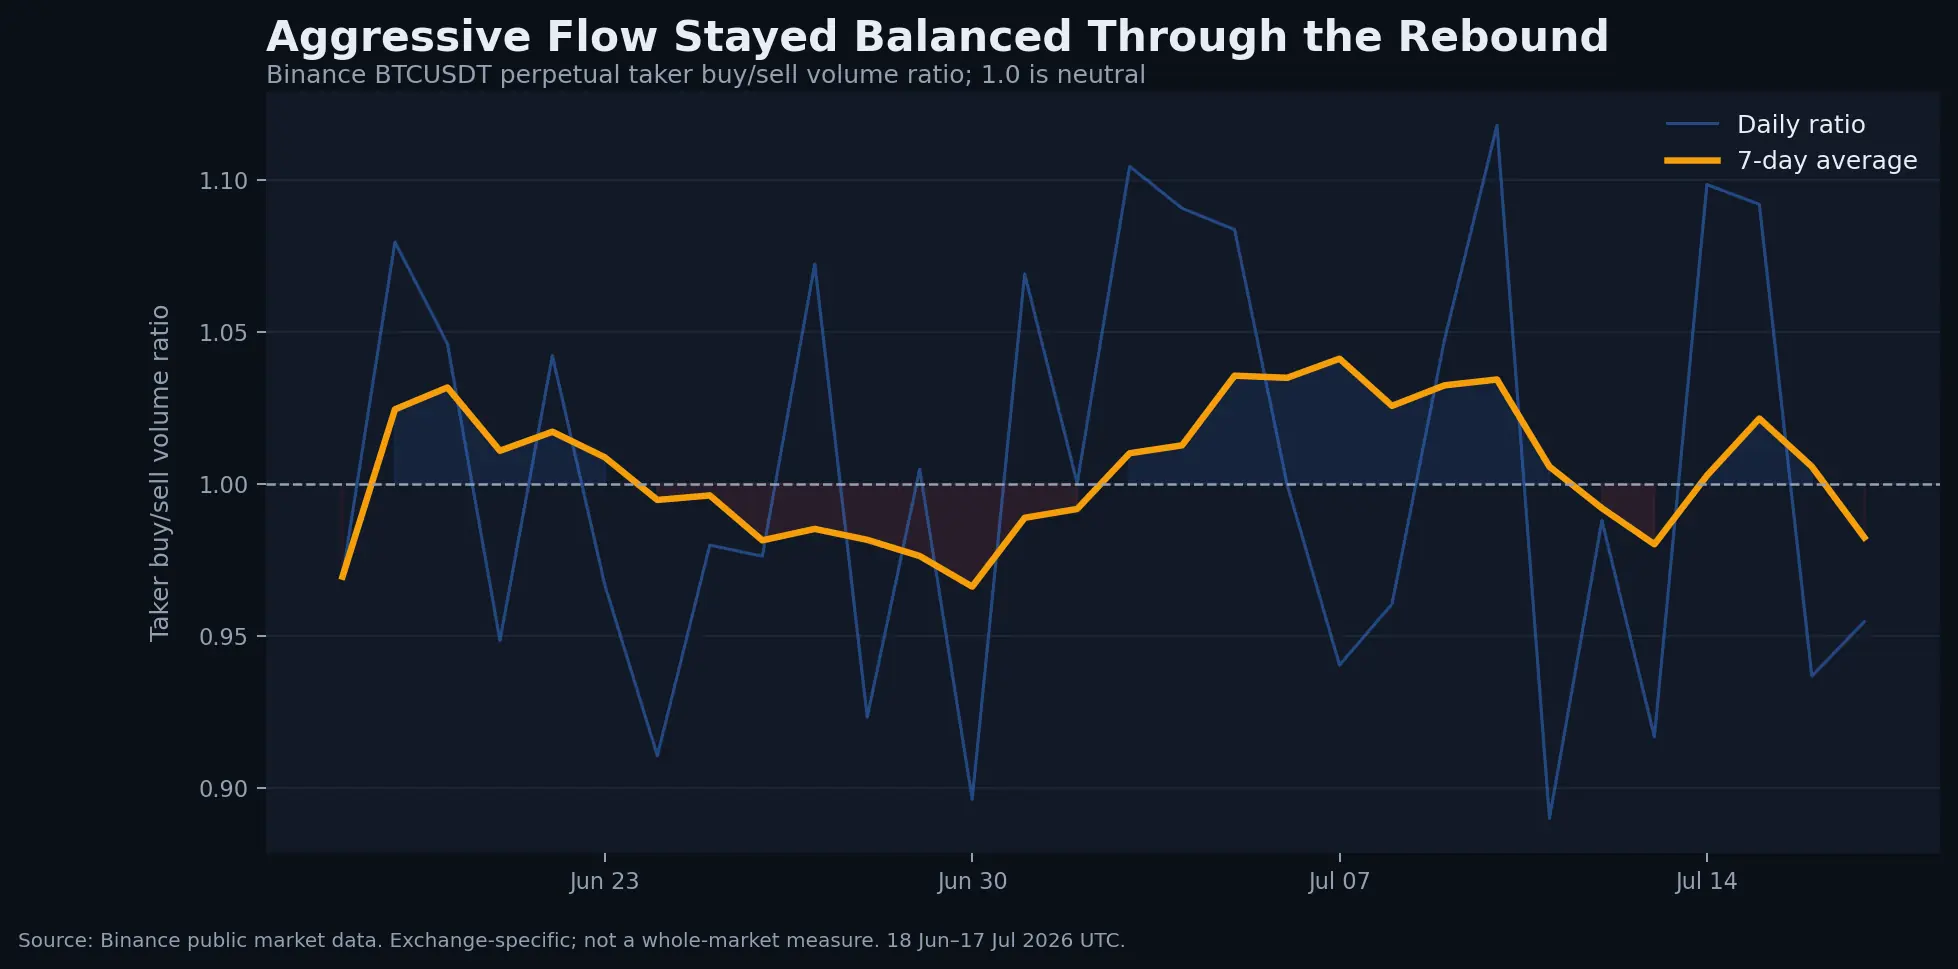
Across the same 30-day window, perpetual-futures longs paid funding in 87 of 90 eight-hour intervals. The average funding rate annualised to roughly 5.8% on a simple, non-compounded basis, and it hit Binance’s 0.01% interval rate ten times. Yet aggressive buy and sell volume remained almost perfectly balanced. The 30-day taker buy/sell ratio averaged 1.003; its latest reading was 0.955.
The distinction matters. Price has recovered, but the evidence does not show an equally decisive recovery in unlevered directional demand. This is not a call for an imminent liquidation. It is a statement about asymmetry: the market is paying more to stay long before it has demonstrated that spot demand can carry the trade on its own.
The signal: Bitcoin’s rebound is credible, but increasingly dependent on demand persisting while long positioning is no longer cheap. A durable breakout needs spot and ETF absorption to broaden before leverage becomes the story.
What changed after the June low
The sequence matters more than the endpoints.
Bitcoin’s Binance Spot daily close fell from $64,298.01 on June 20 to $58,624.71 on June 30, a decline of 8.8%. It then recovered to $65,043.98 on July 14 before closing at $63,931.67 on July 17. That rebound repaired most of the damage, but it did so while the cost of holding perpetual longs rose.
Funding turned negative only three times in the 90 observations from June 18 through July 17. During the late-June sell-off, that reluctance to reset was notable: longs were generally still paying even as price fell. During the recovery, funding printed at 0.01% per eight hours ten times—a repeated high within this sample. Binance’s funding-rate information endpoint reported a 0.30% cap for BTCUSDT when rechecked on July 21, but that cap is a venue risk limit, not a threshold for interpreting positioning.
There are two ways to read this.
The constructive interpretation is that demand was strong enough to overcome the cost of leverage and absorb the June drawdown. The cautious interpretation is that traders rebuilt directional exposure before the market established a wider base of price-insensitive buyers.
Both can be true. Funding is not a reversal indicator. Positive funding can persist for months in a strong trend. Its value is diagnostic: it tells us who is paying to maintain exposure and how expensive that exposure has become.
This updates the distinction we made in May between Bitcoin sentiment and actual derivatives positioning. Fear can reset much faster than leverage; the two measures answer different questions.
The rebound did not come with one-way aggressive buying
The taker buy/sell volume ratio measures the balance of aggressive futures orders on Binance. A reading above 1 means taker-buy volume exceeded taker-sell volume; below 1 means the reverse. It is not a complete measure of global spot demand, and it should never be presented as one.
Still, it offers a useful cross-check. If the recovery were being driven by overwhelming, persistent directional demand on this venue, we would expect the ratio to hold materially above 1. It did not. Across 30 daily observations, the average was 1.003. The seven-day average ended at 0.982—slightly sell-dominant—while the latest daily observation was 0.955.
This does not invalidate the rally. Passive limit buyers can absorb market sells without producing a high taker-buy ratio. ETF-related execution can occur across venues and through mechanisms not visible in one Binance series. Market makers can also hedge exposure elsewhere.
But the absence of sustained taker dominance removes one easy explanation. The recovery was not simply a flood of aggressive buyers chasing price higher.
ETF demand improved, but it has not yet erased the distribution problem
ETF flows supply the most important off-exchange cross-check because they capture demand through regulated U.S. wrappers. The flow pattern around the turn of the month was violent rather than stable. Farside’s daily table recorded aggregate U.S. spot Bitcoin ETF inflows of $223.5 million on July 2 and $265.7 million on July 6. Later sessions alternated between inflows and outflows, including a $424.7 million outflow on July 13 and a $181.1 million inflow on July 14. The sequence improved after the sharp July 13 reversal, but it did not establish an uninterrupted allocation regime.
The size of the installed base is no longer in question. BlackRock reported $47.99 billion in net assets and 1.30188 billion shares outstanding for IBIT as of July 20, 2026, with a 0.03% 30-day median bid/ask spread as of the same date. The wrapper is liquid, large and operationally mature.
That is the structural point behind our earlier argument that a bank-sponsored Bitcoin ETF is primarily a distribution story: the durable change is who can access the asset and through which channel, not the size of any one launch-day flow.
The question is marginal demand. A large asset base can coexist with net redemptions. ETF success as a product does not guarantee continuous buying of the underlying asset.
This is where much crypto commentary makes a category error: it treats the existence of institutional infrastructure as if it were the same thing as current institutional risk appetite. Infrastructure expands the potential buyer base. Flow data tells us whether that base is allocating now.
Coinbase’s July positioning data identified the reset—our update shows the rebuild
Coinbase Institutional’s July positioning report described broad de-risking into the end of June: softer BTC funding, negative ETH funding, deteriorating options skew, weaker ETF flows and short-term holders realising losses. It also noted an improvement in Coinbase’s BTC order-book depth, which had flipped to the bid.
That was the reset.
The Binance data through July 17 shows what happened next. Funding did not merely normalise; it repeatedly returned to 0.01% per eight-hour interval. Price recovered, while taker flow remained balanced. In other words, the market’s ability to absorb supply improved, but leveraged willingness rebuilt faster than clear aggressive demand.
That combination is better than a rally driven by frantic taker buying and collapsing depth. It is also less comfortable than a rally in which funding stays neutral while ETF flows and spot depth steadily expand.
Open interest is large, but the absolute number is not the signal
Binance reported 100,462.385 BTC of open interest in BTCUSDT perpetual futures at 17:27 UTC on July 17—about $6.44 billion using the approximately $64,072 mark price in that minute. That is one venue and one contract, not global Bitcoin leverage.
The number should not be used in isolation. Open interest rises when new positions are created on both sides of a contract; it does not tell us whether the new risk is net bullish or bearish. It also grows mechanically in dollar terms when Bitcoin’s price rises.
What matters is the combination:
- Open interest rising + price rising + funding accelerating: more long exposure is being paid for; upside can continue, but liquidation sensitivity increases.
- Open interest falling + price rising: shorts may be closing or the market may be deleveraging into strength.
- Open interest rising + price flat + balanced taker flow: risk is accumulating without resolution.
- Open interest falling + price falling: leverage is leaving; this can be capitulation or an orderly reset depending on depth and liquidations.
The present snapshot belongs closest to the first and third states. It is not extreme enough, on the evidence here, to declare a blow-off. It is no longer cheap enough to ignore.
Why positive funding is not automatically bearish
There is a temptation to turn every derivatives metric into a contrarian trigger. That is a mistake.
Funding is a transfer between long and short perpetual-futures positions designed to keep the contract near its underlying index. Positive funding generally means longs pay shorts. It can reflect bullish demand, hedging imbalances, market-maker inventory or differences in the availability and cost of capital.
A simple annualisation of the 30-day average produces approximately 5.8%. That figure is useful for comparison, not as a realised return forecast. Funding is variable, interval conventions differ across exchanges, compounding changes the result, and a short position carries price and liquidation risk.
The correct question is not whether funding is positive. It is whether the expected price move and portfolio hedge justify the cost—and whether that cost is rising faster than evidence of new demand.
The three tests that decide whether this recovery becomes a trend
1. ETF flows must persist, not merely flip for a few sessions
A durable signal would be multiple weeks of positive aggregate creations spread across more than one issuer, rather than one product dominating a brief reversal. The relevant comparison is aggregate net flow versus price impact and market depth—not a single fund’s headline.
2. Funding must stop accelerating as price advances
The healthiest continuation would be price holding above the recovered range while the average funding rate cools. That would suggest spot absorption is carrying more of the move. If funding repeatedly prints 0.01% per interval while price fails to advance, the market is paying a continuing carry cost for diminishing progress.
3. Bid depth must survive a retest
Improved order-book depth matters only if it remains available when sellers arrive. Displayed liquidity can disappear during stress. The best confirmation would be a retest of the low-$60,000s accompanied by stable spreads, limited slippage, lower liquidations and rapid spot absorption.
The bear case—and what would prove it wrong
The bear case is not simply “funding is positive.” It is that positive carry, large open interest and inconsistent ETF demand leave a crowded market vulnerable to a liquidity gap. A failed push through the mid-$60,000s, followed by ETF outflows and a break of the recovered range, could force long liquidations to supply the next leg lower.
That case would be wrong if Bitcoin holds the recovery while funding cools, ETF creations persist and spot depth remains bid through volatility. It would be decisively wrong if price advances with no comparable expansion in leverage—evidence that new capital, not just recycled derivatives risk, is setting the marginal price.
Where I stand
The June low increasingly looks like a tradable exhaustion point. It does not yet look like proof of a new, self-sustaining allocation cycle.
The price recovery deserves respect. So does the cost paid to maintain it. With funding positive in 87 of 90 intervals, ten readings at 0.01%, and a 30-day taker ratio of 1.003, the market has moved from fear to willingness—not yet from willingness to conviction.
The distinction will be resolved by the next test of liquidity. If spot and ETF demand broaden while leverage cools, this rebound can graduate into a trend. If price stalls while carry remains elevated, the same positions that helped lift the market will become the supply the market has to absorb.
For now, the rebound is real. The cushion underneath it is thinner than the price chart suggests.
Data, methodology and limitations
Market-data cutoff: 17 July 2026, 17:30 UTC. External product pages, ETF-flow tables and Binance contract settings were rechecked on 21 July 2026. BlackRock product statistics are dated 20 July 2026 on the issuer page.
Cryptophia Research downloaded Binance Spot BTCUSDT daily klines and Binance USD-M BTCUSDT perpetual funding, futures klines, global long/short account ratios and open interest. The daily taker buy/sell ratio was reconstructed from each USD-M futures kline as taker-buy base volume divided by total base volume minus taker-buy base volume; it matched Binance’s dedicated taker-ratio series on all 29 overlapping dates available for comparison. Funding annualisation is the arithmetic mean interval rate multiplied by three intervals per day and 365 days; it is simple and non-compounded. All Binance measures are exchange-specific and do not represent the entire Bitcoin market. Account ratios count accounts rather than position size and were not used as primary evidence.
ETF flow observations use Farside Investors’ U.S. spot Bitcoin ETF table. IBIT product statistics use BlackRock’s official product page. The Coinbase Institutional report is used as an external positioning cross-check, not as a source for Cryptophia’s Binance calculations.
Read the leverage signals separately: use the guides to open interest, funding rates and forced-timing risk before treating a positioning snapshot as directional proof.
Sources
- Binance USDⓈ-M Futures market-data documentation
- Coinbase Institutional — Crypto Market Positioning, July 2026
- Farside Investors — U.S. Bitcoin ETF flow table
- BlackRock — iShares Bitcoin Trust ETF
Disclosure: This research is for information and education only. It is not investment advice, a recommendation, or an offer to buy or sell any asset. Digital assets and derivatives involve substantial risk, including loss of principal.