

Sophia Lopez · Cryptophia Research · 10 June 2026
One week ago the debate was when the Fed would cut. Today Polymarket prices a 52% chance the Fed hikes before year-end, CME FedWatch sits near 43% for higher rates by December, and BNP Paribas has scrapped its stable-rate forecast for three hikes starting in December. That flip happened in five trading sessions, and it is the only thing about this drawdown that matters.
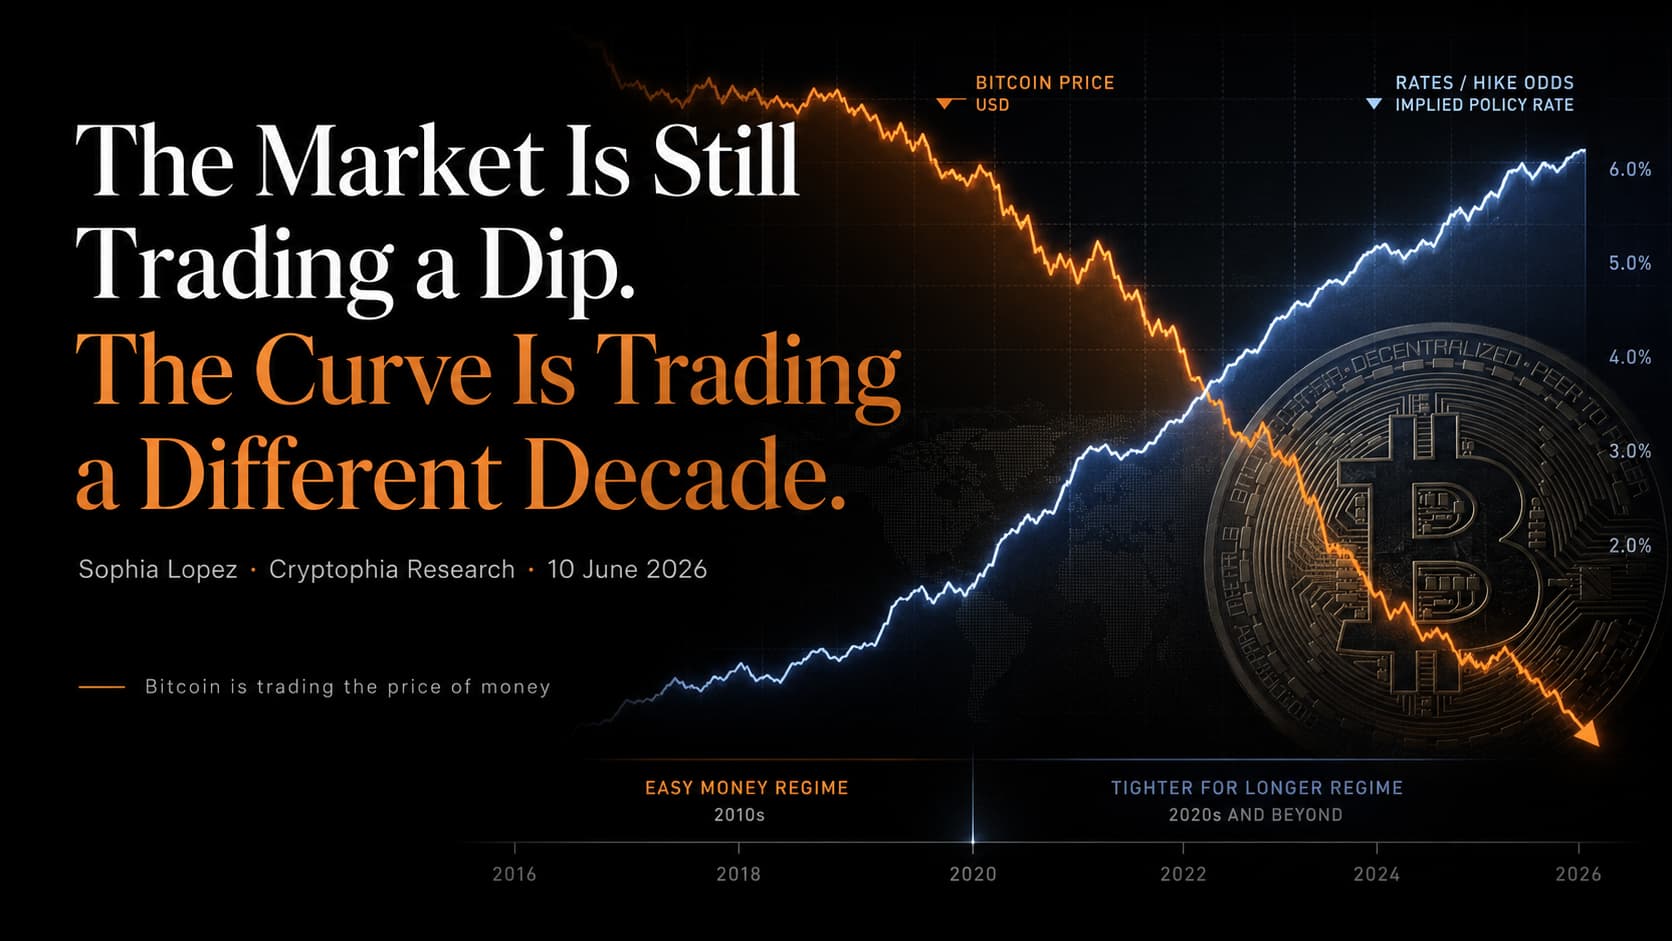
Bitcoin trades near $62,600 as I write this. It printed $59,100 on June 5, its lowest level since late 2024, and sits more than 50% below the October 2025 high around $128,000. The commentary wants to make this a crypto event: a record ETF outflow streak, Strategy trimming, $1.7B in liquidations in a single day. I think that framing gets the causality backwards, and if you trade the crypto framing here, you will buy a dip inside a regime change and call it value.
The Curve Flipped and Nobody Renamed the Trade
Walk through what actually happened, in order.
The Fed has held at 3.50% to 3.75% since December. Through the spring, the market carried a comfortable assumption: inflation was sticky but the next move was still down, sometime in the second half. Core PCE around 3%, a war in the Middle East feeding energy prices, and a Fed projection of 2.7% inflation for the year all argued for patience, but the direction of travel was never in question. Then the June 5 payrolls print came in hotter than any reading in 18 months, and the question changed from when the easing starts to whether the next move is up.
That is not a delay. A delay moves the same trade later in time. This repriced the sign of the trade. Hike odds went from a tail to a coin flip in a week, the Nasdaq dropped 5% in its worst session since Liberation Day, and the dollar firmed. Every asset whose valuation is a claim on future liquidity got hit, and Bitcoin, which is the purest such claim in existence, got hit first and hardest. It has no earnings to discount and no coupon to clip. It is a bet on the cost of the next marginal dollar, and the market just raised its estimate of that cost twice in a month.
There is one more layer, and it is the one I’d want subscribers thinking about into next week. The June 16 to 17 meeting is Kevin Warsh’s first as chair. The consensus read on his appointment has been political: a White House at war with the Fed installs a chair who once favored cuts, so the path of least resistance bends dovish. I think that read has the history of new Fed chairs exactly backwards. A chair who arrives under suspicion of being the administration’s man has one asset to establish, and it is independence. The cheapest way to buy credibility in your first meeting is to refuse to be what the market accuses you of being. Positioning built on “political Fed equals easy Fed” is not just early. It may be structurally wrong about the man’s incentives, and it is exactly the cohort that gets carried out if the June statement leans hawkish.
The ETF Streak Is a Thermometer, Not a Disease
Now the number everyone leads with: 13 consecutive sessions of spot ETF outflows, roughly $4.4B, the longest streak since these products launched. In coin terms, Galaxy Research counts the 7-day and 10-day windows at 39,338 and 42,941 BTC, both records. The streak has erased every dollar of 2026 inflows. Citi estimates spot ETF flows explain roughly 45% of weekly price moves, and that figure is an estimate, not gospel, but the direction is obviously right: when the cycle’s biggest buyer becomes a daily seller, the floor is whatever leverage decides it is.
Here is why I refuse to treat the flows as the story. An ETF outflow is not a cause. It is an allocator expressing the same macro view I just described, through the only crypto instrument a compliance department will let them touch. The money leaving IBIT is not fleeing Bitcoin for cash under a mattress. It is rotating into AI equities and a megacap IPO calendar, because in a world where the next Fed move might be up, allocators want duration with cash flows attached or they want the momentum trade, and Bitcoin is neither. Reading the outflow streak as a crypto-specific demand problem is reading the thermometer and diagnosing the thermometer.
The same goes for the forced selling. The $1.7B liquidation day, the whale deposits to Binance doubling, the cascade through $65,000 and $62,000: that is the leverage that accumulated during the cut-pricing regime being cleared out by the hike-pricing regime. Painful, mechanical, and informationally empty about where this stops.
The Case Against My Own Position
I’m bearish until the curve says otherwise, so let me state plainly where that’s vulnerable.
First, the entire hike repricing leans on one payrolls print. One. Employment data has been noisy for two years, revisions have been brutal, and a 52% hike probability built on a single release can unwind as fast as it built. Second, the tape is stretched: RSI deeply oversold, sentiment washed out, and June 5 itself produced the first net ETF inflow session of the streak, which is the earliest possible sign of institutional dip-buying at the margin. Third, the Warsh meeting cuts both ways. Positioning has now swung so fast toward the hawkish read that a merely neutral statement could squeeze this market $5,000 higher in two sessions. A bounce here would prove nothing about the regime, but it would hurt anyone short with leverage, which is why I’d express this view without it.
One thing I genuinely don’t know: how much of the ETF outflow is macro rotation versus tax-and-mandate selling that ends on its own calendar. The coin-term records suggest real distribution, but flow data can’t separate motive, and I won’t pretend it can.
The Line I’ll Be Held To
My read: this is a liquidity regime change, not a dip, and rallies into the mid $60,000s are distribution until the rate path flips back. The falsification is specific. If hike-by-December odds collapse back below 20% on Polymarket and FedWatch, and Bitcoin reclaims and holds $68,000 on that move, the regime case is dead and I’ll write the post-mortem under this byline with this note linked. If instead the June statement leans hawkish and $59,100 gives way, the next liquidity shelf worth respecting is $55,000, and I would rather miss the first 10% of a real bottom than fund someone else’s exit at $64,000.
The asset is doing its job. It told you the price of money changed before the equity market wanted to hear it. Listen to it now too.
Data notes per Cryptophia data rules: BTC spot, the June 5 low, and the federal funds range are point-in-time public data, re-confirm spot on publication day. ETF flow totals per SoSoValue and Eric Balchunas (Bloomberg); coin-denominated flow records per Galaxy Research; the 45% flow-to-price figure is a Citi estimate and labeled as such. Hike probabilities per Polymarket and CME FedWatch, both fast-moving, re-check before publishing. Strategy’s holdings (~843,000 BTC) are as publicly reported; its average cost is not cited here because I could not confirm it against a primary source.
Two companion analyses test different parts of this thesis: whether leverage rebuilt beneath Bitcoin’s rebound, and whether Bitcoin was still following the Fed at all.