


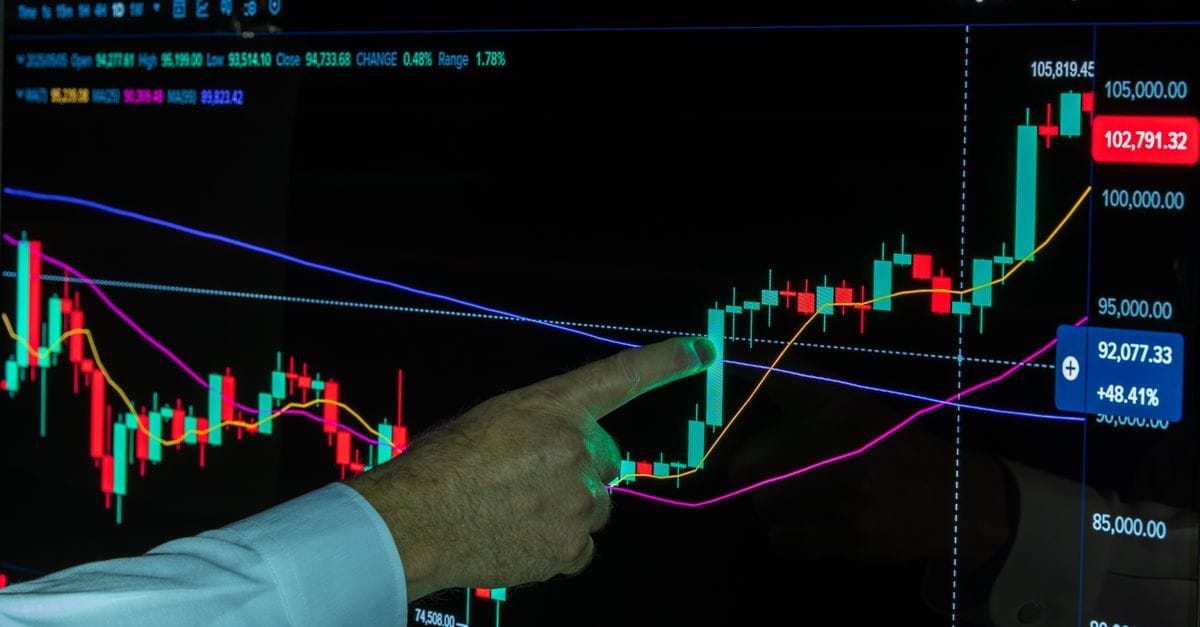
A blockchain can record a transaction perfectly while an analytics chart describes it badly. The gap appears when raw events become economic categories.
Minimum trust standard: the minimum unit of trust is not the dashboard. It is the tuple of definition, address set, transformation, timestamp and revision policy. If one element is unknown, the chart is evidence with an unpriced limitation.
Direct answer: on-chain data is reliable for proving that defined blockchain events occurred under the chain’s consensus history. On-chain analysis is less certain when it claims who controlled the addresses, why funds moved, whether activity represents real users or what will happen to price.
What is on-chain data?
On-chain data is information recorded in a blockchain’s public or permissioned ledger. Depending on the network, it can include:
- transaction hashes and block heights;
- sender and receiver addresses;
- asset quantities and fees;
- smart-contract calls and emitted events;
- token balances and supply changes;
- validator, staking or governance activity;
- unspent transaction outputs;
- timestamps or block ordering.
This raw blockchain data can establish that a transaction was included in a block. It does not automatically identify the legal owner, economic purpose, off-chain agreement or complete strategy behind the event.
What is on-chain analysis?
On-chain analysis transforms blockchain events into metrics and narratives about users, entities, networks and markets. Examples include:
- exchange inflows and reserves;
- long-term-holder supply;
- Smart Money accumulation;
- active users or addresses;
- protocol revenue;
- whale balances;
- realised price and MVRV;
- stablecoin supply and velocity.
Each metric requires definitions, address sets, classifications, valuation rules and time aggregation. The transformation can be useful and still remain uncertain.
Raw does not mean interpreted
A transaction hash, block height, address, contract and quantity can be directly observed. The following statements cannot be observed without additional rules:
- “An exchange received customer deposits.”
- “Long-term holders sold.”
- “Smart Money accumulated.”
- “One million users adopted the network.”
- “Protocol revenue accrued to tokenholders.”
- “Whales are bullish.”
The blockchain supplies events. The data provider and analyst supply categories and causal stories.
Can on-chain data be manipulated?
Confirmed blockchain history is difficult to alter on a secure network without satisfying or attacking its consensus rules. The economic signals built from that history can still be manipulated or distorted.
Examples include:
- one actor creating many addresses to inflate activity;
- bots generating transactions;
- wash trading and circular volume;
- incentives purchasing temporary users or liquidity;
- tokens transferred among related wallets;
- spam assets contaminating address or holder counts;
- internal exchange movements appearing as deposits or withdrawals;
- governance actors changing metric-relevant contracts;
- providers using incomplete or stale label sets.
Immutability protects the recorded event. It does not make the event economically honest or the interpretation correct.
Is on-chain data secure?
Blockchain data integrity depends on the network’s consensus, node software, cryptography and finality model. Analytics accuracy adds more dependencies:
- node and indexer completeness;
- chain reorganisations and finality;
- smart-contract decoding;
- token and contract identity;
- address clustering;
- off-chain market and price data;
- vendor infrastructure and revision policy.
A secure chain can feed an inaccurate dashboard if the indexer missed events, the contract was decoded incorrectly or the labels were wrong.
Five transformations that change the story
1. Address labels
A provider decides that addresses belong to an exchange, fund, bridge, market maker or other entity. Wallet migrations, shared custody and incomplete clusters can change the series.
2. Entity adjustment
Multiple addresses may be grouped as one actor. This can reduce change-address or internal-transfer noise, but it introduces a model of common control.
3. Cohort rules
Long-term holders, whales and Smart Money are definitions with age, balance, performance or behaviour criteria. A different threshold creates a different population.
4. Valuation
Token quantities become dollars through a price source, timestamp and market selection. Illiquid tokens, wrapped assets and stablecoin depegs make the choice material.
5. Time aggregation
A daily value can use opening, closing, average or end-of-day prices. Flows can be gross, net or entity-adjusted. Time zones, publication lag and later revisions can change a visible spike.
On-chain vs off-chain data
| Data type | Examples | What it can prove | Main blind spot |
|---|---|---|---|
| On-chain | Transactions, contracts, balances, supply | Recorded blockchain events | Identity, motive and off-chain agreements |
| Exchange internal | Order books, user balances, liquidations | Activity inside one platform | May not be publicly auditable |
| Market data | Prices, volume, spreads, derivatives | Observed market conditions | Venue quality and wash trading |
| Legal and organisational | Filings, terms, treasury controls | Rights, entities and obligations | Can lag technical changes |
| Qualitative | Developer notes, governance discussion | Context and stated intent | Statements may be incomplete or promotional |
Strong analysis combines different evidence types. Two dashboards built from the same chain are not fully independent confirmation.
Examples of correct data and wrong inference
Exchange inflows
The chain can correctly show coins entering a labelled address cluster. “Investors are about to sell” requires the label to be complete, the transfer to be external, the coins to be available for sale and the owner not to be hedged elsewhere.
Active addresses
Rising active addresses can reflect adoption, bots, an airdrop, one application, sybil farming or one user operating many wallets.
Protocol fees
Fees can rise while tokenholders receive nothing. Validators, liquidity providers, a company or treasury may capture the value.
Stablecoin supply
Supply can increase without an immediate crypto purchase. Stablecoins can remain idle, settle invoices, collateralise derivatives or move between chains.
Smart Money
A labelled profitable wallet can be market making, hedging, vesting, providing liquidity or executing one leg of a larger strategy.
The chart is not necessarily lying. The sentence attached to it is doing too much work.
Can on-chain analysis predict crypto prices?
On-chain analysis can identify conditions that matter to a price thesis, such as supply positioning, exchange inventory, leverage, user activity or protocol economics. It cannot reliably guarantee direction or timing.
Price also depends on:
- spot and derivatives liquidity;
- macro events and interest rates;
- regulation and market access;
- off-chain custody and OTC markets;
- narrative and positioning;
- execution costs and forced liquidation;
- information not visible on-chain.
A useful metric narrows scenarios. It does not replace risk management.
How to combine on-chain and technical analysis
On-chain data can describe network, holder or entity conditions. Technical analysis describes price, volume and market structure. Use them as different evidence layers.
- Define the on-chain mechanism.
- Identify the expected price or volume response.
- Check whether spot or derivatives confirm it.
- Define the time horizon.
- Record the alternative explanation.
- Set the invalidation level or event.
Do not use a technical pattern to “confirm” an on-chain story when both are merely reactions to the same price move.
How AI affects on-chain analysis
AI can make blockchain intelligence easier to query, summarise and monitor. It can:
- translate natural-language questions into data queries;
- summarise wallet or protocol activity;
- detect anomalies across large datasets;
- classify transactions and entities;
- generate alerts and draft explanations.
AI inherits errors in labels, decoded contracts and market data. It can also invent a causal explanation when several mechanisms fit the same event.
Require AI output to expose:
- the source data;
- the metric definition;
- the query or transformation;
- the time range;
- the confidence and alternatives;
- the raw transactions behind a material conclusion.
On-chain data for security and compliance
Blockchain intelligence can support:
- transaction tracing;
- sanctions and risk screening;
- incident response;
- proof-of-reserves verification;
- fraud and exploit investigation;
- treasury and governance monitoring.
Attribution can create serious consequences. A label should not be treated as legal proof without evidence, review and appropriate process. Shared custody, deposit addresses and address poisoning can create false associations.
A chart audit in eight questions
- What raw event is observable?
- Which addresses or entities are included?
- What transformation creates the metric?
- What assets and markets are covered?
- What is the resolution and publication lag?
- Can historical values be revised?
- What alternative mechanism could move the chart?
- Which independent source can challenge it?
A miniature case: exchange reserves
Suppose a dashboard shows a sharp fall in exchange reserves. The raw chain may accurately show coins leaving a labelled address cluster.
The interpretation “investors withdrew to hold long term” requires extra claims:
- the exchange cluster was complete;
- the movement was not internal;
- the destination was not another custodian;
- the coins were not pledged or routed to another venue;
- the label did not change after a custody migration.
A defensible publication sentence is: “The provider’s labelled exchange balance fell by the stated amount. Customer withdrawals are one possible mechanism; alternative explanations include wallet migration and coverage changes.”
Revision policy matters
Address intelligence improves, indexers backfill data and metric definitions change. Historical series can be recalculated after new clusters, contracts or exclusions are added.
Store the download date and, for important decisions, preserve the series used at the time. A later revision should update the thesis record rather than silently making the original chart appear more accurate.
For backtests, prefer Point-in-Time data where available. Current revised history can include information that did not exist when the hypothetical decision was made.
Vendor agreement is not full independence
Two platforms may use the same public blockchain, similar prices and overlapping address intelligence. Agreement increases confidence that a movement occurred. It does not automatically validate the economic explanation.
Seek a different evidence type:
- block explorer and contract evidence;
- exchange or custodian disclosure;
- spot and order-book execution;
- protocol accounting;
- governance proposals;
- legal or regulatory filings.
Three adversarial checks
Change the definition
If a holder threshold, exchange cluster or revenue allocation changes, does the conclusion survive?
Change the window
A one-day spike may disappear in a weekly series or begin before the event used to explain it.
Look for the missing entity
An unlabelled exchange, bridge, custodian or internal migration can change the apparent flow without changing investor behaviour.
Common on-chain metrics and their limits
| Metric | Useful question | Unsafe shortcut |
|---|---|---|
| Active addresses | How many addresses interacted? | Equals unique human users |
| Transaction count | How many transactions occurred? | Equals economic adoption |
| Exchange reserve | How much is in labelled clusters? | Equals sellable supply |
| Net flow | Did labelled inflow exceed outflow? | Predicts immediate direction |
| TVL | How much value is deposited under the methodology? | Equals unique productive capital |
| Protocol revenue | What value was retained under the definition? | Belongs to tokenholders |
| MVRV | How does market value compare with realised value? | Provides a mechanical buy/sell level |
| Whale balance | How did a defined cohort change? | Reveals bullish or bearish intent |
A reproducibility record for every chart
| Field | Why it matters |
|---|---|
| Vendor and metric | Names can hide different models |
| Definition version | Rules and address sets change |
| Asset, chain and entities | Coverage determines what is absent |
| Time window and zone | Daily boundaries can move a spike |
| Price source | Currency transformations introduce another model |
| Query and revision time | Historical series may be backfilled |
| Raw source or endpoint | Another analyst needs a path to reproduce it |
| Inference and alternative | Observation must be separated from the story |
Minimum citation block for an on-chain claim
- Vendor and exact metric name.
- Asset, entities and cohort definition.
- Time range, interval and as-of timestamp.
- Price source for currency-denominated values.
- Known lag or revision caveat.
- Observation separated from interpretation.
- Independent challenge or corroboration.
How a publication should write uncertainty
Do not write “whales accumulated” when the evidence is an increase in a vendor-defined balance cohort. State what the series measures, identify the model and separate the observed change from the possible mechanism.
Do not make one chart carry the causal conclusion when it supports only one part of the thesis.
How Cryptophia should use vendor data
- Name the vendor and exact metric.
- Record the timestamp and definition.
- State the observation before the inference.
- Write the strongest alternative explanation.
- Use a second provider or primary source for material claims.
- Record what would invalidate the reading.
- Preserve the original series or screenshot with context.
This protocol applies to the Glassnode, CryptoQuant, Nansen and Token Terminal reviews.
When a dashboard is worth paying for
Models are not a reason to reject analytics. A consistent, documented transformation can reveal patterns that raw transaction lists obscure.
Payment is rational when:
- the same metrics are used repeatedly;
- definitions and revisions are documented;
- data can be exported or reproduced;
- alerts or APIs replace recurring manual work;
- the information changes a real research or risk decision.
The discipline is to preserve the definition beside the number.
The stopping rule
If the conclusion changes materially under another reasonable definition, present a range or competing interpretations. Do not select the definition that produces the cleanest narrative.
Final answer
On-chain data is powerful because blockchain events can be publicly verified. On-chain analysis becomes uncertain when providers classify entities, group addresses, define cohorts, apply prices, aggregate time or infer motive.
Trust the transaction under the chain’s rules. Audit the metric under the provider’s rules. Challenge the narrative under alternative mechanisms.
Apply the definition test to exchange inflows and outflows, realised price and MVRV, and the best on-chain analytics tools.